
When it comes to organizing information visually, free printable charts and graphs can be incredibly useful. These resources help you to present data clearly, making it easier to analyze trends, compare figures, and share insights. If you are a teacher preparing lesson materials, a student working on a project, or someone looking to keep personal goals in check, these printable resources can make a significant difference. In this article, we’ll explore the different types of charts and graphs available, how to use them effectively, and what information you can organize with them.
Types of Charts and Graphs Available
There are several types of charts and graphs you can find as printable resources, each serving a unique purpose. Here’s a rundown of some popular options:
- Bar Graphs: Great for comparing quantities across categories. For instance, you can use a bar graph to show sales data over different months.
- Line Graphs: Perfect for tracking changes over time. If you’re monitoring your weight loss journey, a line graph can visually represent your progress.
- Pie Charts: Excellent for displaying parts of a whole. If you’re budgeting your monthly expenses, a pie chart can illustrate how much of your income goes to various categories.
- Scatter Plots: Useful for showing relationships between two variables, such as hours studied versus test scores.
Each type of chart or graph has its own strengths and is suited for different kinds of data. Knowing which one to use can enhance the clarity of your information.
How to Choose the Right Chart or Graph
Selecting the appropriate chart or graph depends on the data you want to represent and the story you wish to tell. Here are some tips to guide your choice:
- Identify Your Data: What kind of information are you working with? If it’s categorical, a bar graph may be best. If it’s continuous data over time, a line graph is more suitable.
- Consider Your Audience: Who will be viewing this data? If it’s for a presentation, you might want a pie chart to make the information digestible at a glance.
- Think About Clarity: The goal is to make your data easy to understand. Avoid overly complex graphs that might confuse your audience.
By considering these factors, you can select a chart or graph that effectively communicates your message.
Filling Out Your Printable Charts and Graphs
Once you’ve chosen your chart or graph, the next step is filling it out accurately. Here’s how to do it effectively:
Gathering Your Data
Before you start filling in the chart, ensure you have all the necessary data at your fingertips. This may involve:
- Collecting numerical data from reliable sources.
- Organizing qualitative data into categories.
- Double-checking your figures to avoid inaccuracies.
Using the Right Format
When you print your chart or graph, consider the format that works best for you:
- Portrait vs. Landscape: Portrait layout typically suits bar graphs, while landscape format is better for line graphs where you need more horizontal space.
- Paper Size: Standard letter size (8.5″ x 11″) is common, but larger sizes can be helpful for presentations or classroom displays.
Filling in the Chart
Now, let’s go through how to fill in the different types of charts:
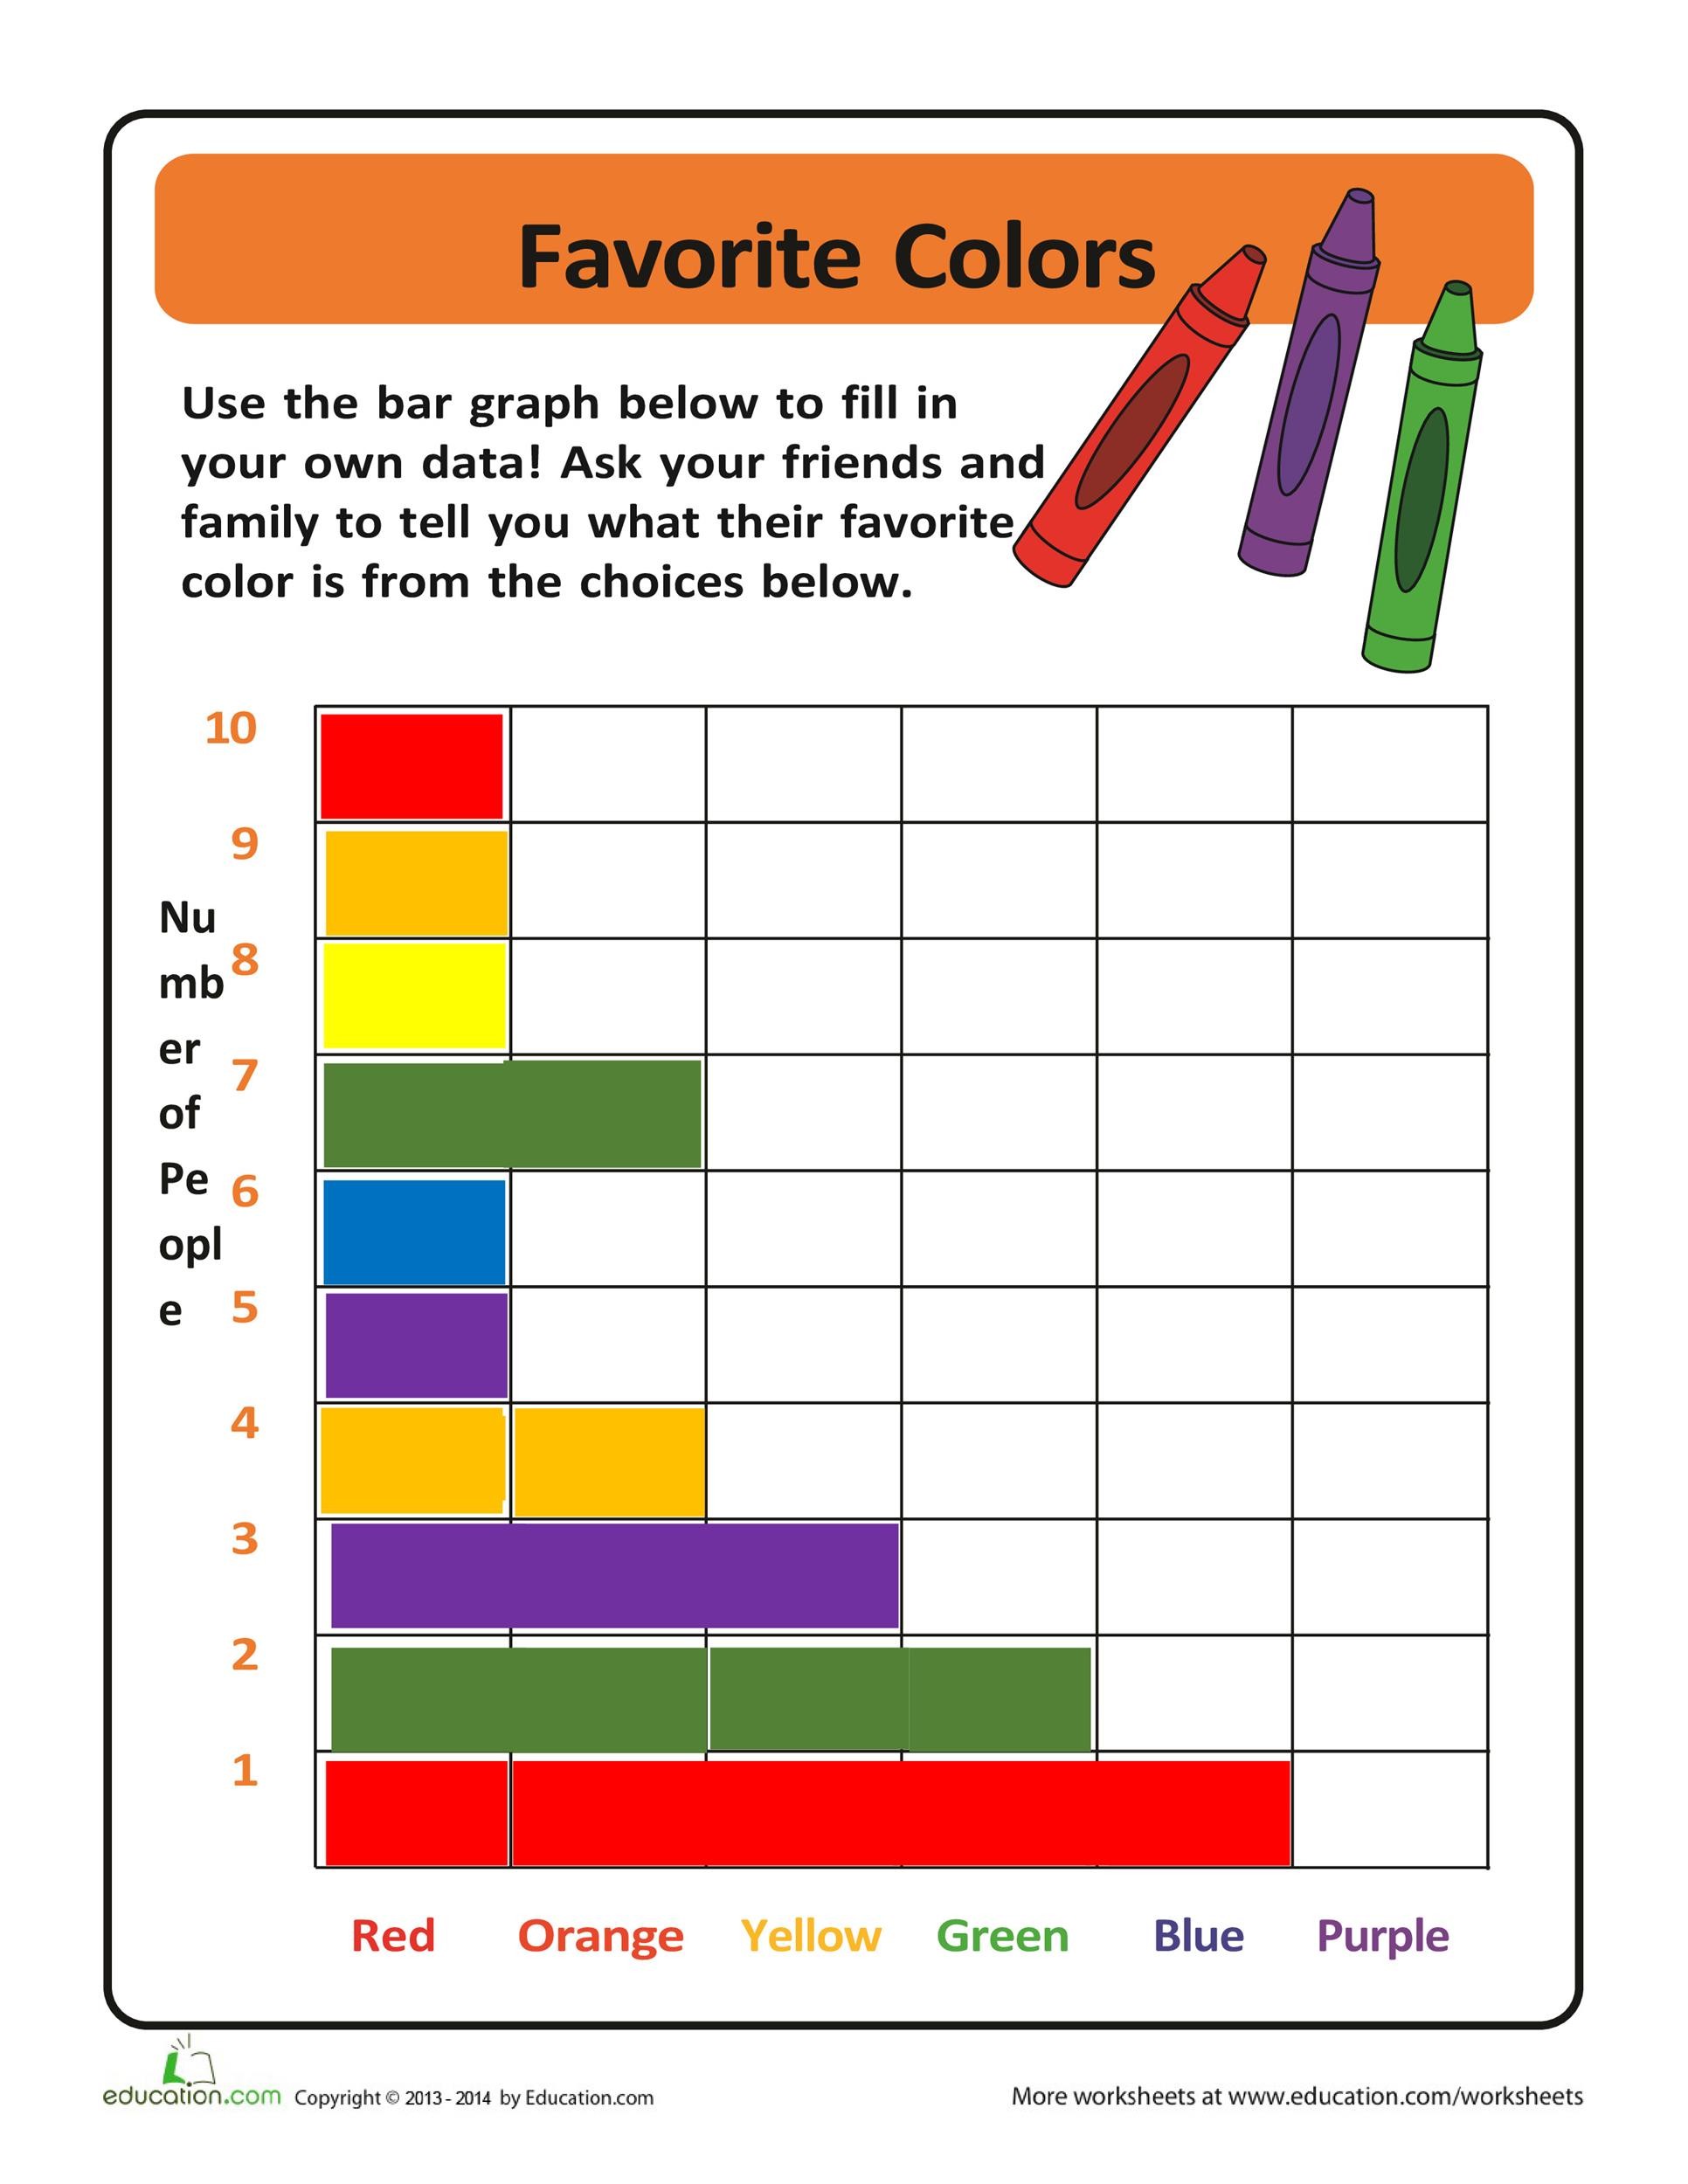
- For Bar Graphs: Start by labeling the x-axis and y-axis based on your categories and values. Then, use a ruler to ensure your bars are of equal width and accurately represent the data.
- For Line Graphs: Mark your x-axis with time intervals and y-axis with the values. Plot the points based on your data and connect them with a line.
- For Pie Charts: Divide the circle into segments that represent the percentage of each category. Use a protractor for accuracy.
- For Scatter Plots: Label the axes clearly and plot each point accurately based on your data pairs.
Make sure to use clear, legible handwriting or a digital tool if you’re creating them online before printing.
Practical Uses for Printable Charts and Graphs
Free printable charts and graphs can be applied in various contexts. Here are some ways you can integrate them into your routine:
- Educational Settings: Teachers can use these resources to create engaging lesson materials or to help students visualize complex concepts.
- Personal Goal Tracking: If you’re tracking fitness goals, budget spending, or even reading habits, these charts can provide visual motivation to keep you on track.
- Business Presentations: When pitching ideas or presenting data, having well-organized charts can help convey your points effectively and persuasively.
By incorporating these charts and graphs into your everyday life, you can enhance your productivity and understanding of various subjects.
Where to Find Free Printable Charts and Graphs
There are many online resources where you can find free printable charts and graphs. Here are a few places to start your search:
- Educational Websites: Many sites offer free resources for teachers and students, including charts and graphs.
- Printable Resource Libraries: Websites dedicated to printable resources often have dedicated sections for charts and graphs.
- Creative Marketplaces: Some platforms allow creators to share their designs, where you might find unique charts for specific needs.
When downloading, ensure that you verify the format (PDFs are usually the easiest to print without losing formatting) and check for any usage rights if you plan to distribute them.
Tips for Effective Printing
When it comes to printing your charts and graphs, consider these tips to ensure the best results:
- Use Quality Paper: If you plan to display your charts, consider using cardstock for durability.
- Adjust Print Settings: Ensure that your print settings match the paper size and orientation you’ve chosen. Most home printers work well with standard letter-size paper, but double-check the layout.
- Preview Before Printing: Always preview your document to catch any errors or misalignments before you hit print.
By following these guidelines, you can produce professional-looking charts and graphs that enhance your presentations and projects.
Incorporating free printable charts and graphs into your routine can simplify data organization and enhance visual storytelling. Whether for personal use, educational purposes, or business needs, these resources provide a straightforward way to present information clearly and effectively.