
Printable Blank Charts and Graphs are fantastic tools for homeschooling. They allow you to visualize data, track progress, and organize information in a way that’s easy to understand. If you are charting your child’s learning milestones or plotting out a science experiment, blank charts and graphs can help you and your students stay organized and motivated.
Understanding Different Types of Printable Blank Charts and Graphs
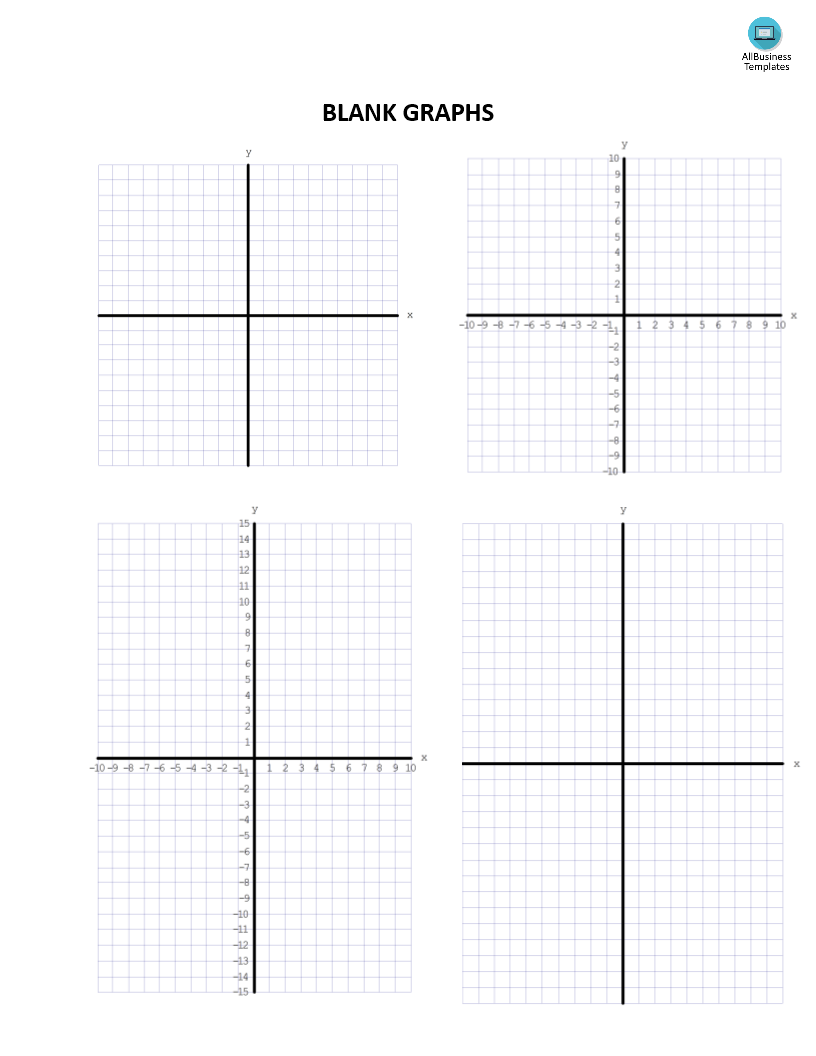
When it comes to printable blank charts and graphs, there are several types you can utilize, each serving a unique purpose. Here are some common formats:
- Bar Charts: Great for comparing quantities across categories. For instance, you can use a bar chart to compare the number of books read by each child in your homeschool group.
- Line Graphs: Perfect for showing trends over time. If you’re tracking your child’s math test scores, a line graph can visually represent their progress.
- Pie Charts: Useful for displaying proportions. You might use a pie chart to illustrate the time spent on different subjects throughout the week.
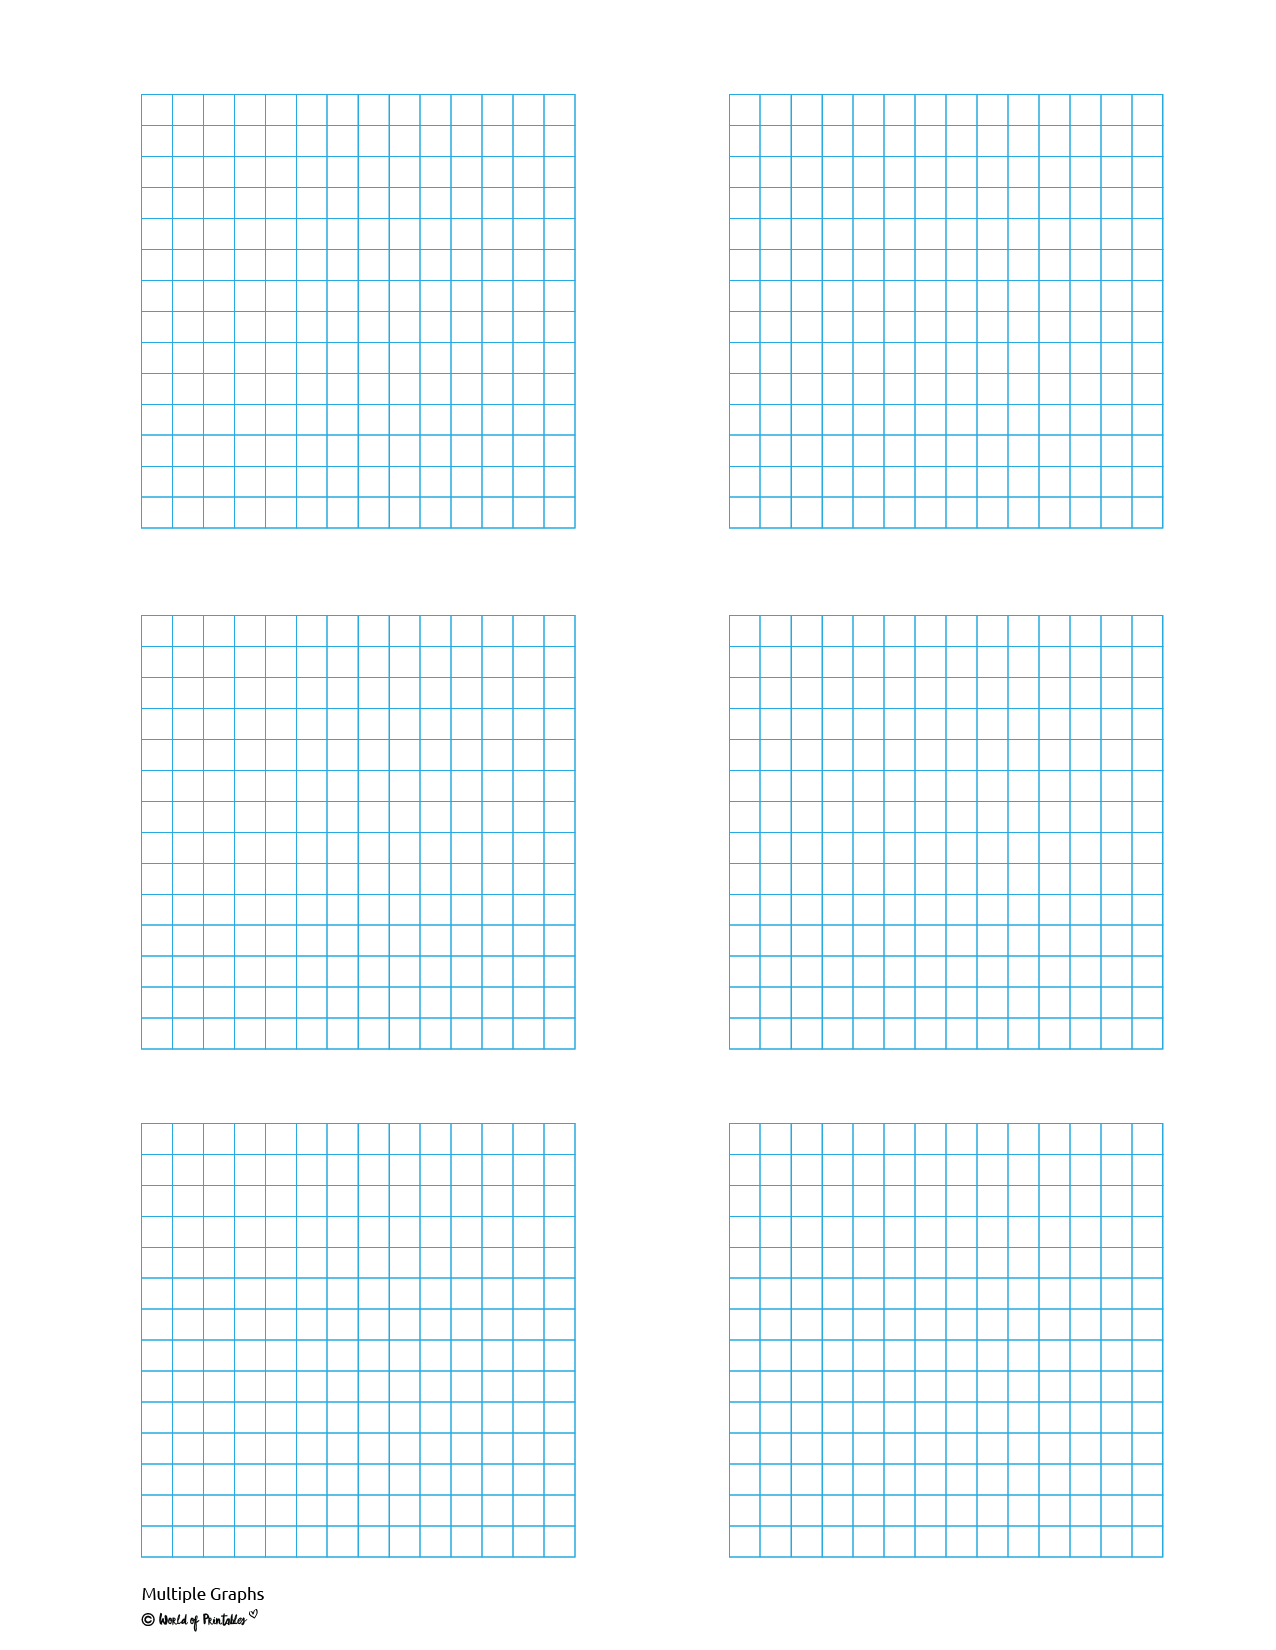
- Grid Paper: While not a traditional chart, grid paper can be used for plotting points, creating graphs, or even drawing.
Each type of chart can be printed in various sizes, typically on standard letter-sized paper (8.5 x 11 inches) or larger formats for more detailed projects.
How to Effectively Use Printable Blank Charts and Graphs
Using these charts effectively requires a bit of planning. Here’s how to make the most of them:
- Identify Your Needs: Before you print, think about what you want to track or visualize. For example, if you’re charting your child’s reading progress, decide on the specific metrics you want to include—like the number of pages read or books completed.
- Choose the Right Format: Depending on your needs, select the type of chart that will best serve your purpose. Bar charts are excellent for comparisons, while line graphs work well for tracking changes over time.
- Print and Prepare: Print your chosen chart on quality paper. If you plan to fill it out frequently, consider using cardstock for durability or laminating the chart for reuse with dry-erase markers.
- Fill It Out Together: Involve your child in the process of filling out the chart. This not only makes it more engaging but helps them understand the data they’re working with.
- Review and Discuss: Regularly review the completed charts with your child. Discuss what the data shows and how it relates to their learning goals. This can provide motivation and insight into areas where they may need extra help.
Common Mistakes to Avoid When Using Blank Charts and Graphs
While using printable blank charts and graphs can be straightforward, there are a few common pitfalls to watch out for:
- Not Keeping It Updated: It’s easy to forget to update charts regularly. Set a specific time each week to review and fill in the charts.
- Overcomplicating Data: Keep it simple. Too many categories or details can make the chart confusing. Stick to the essentials to maintain clarity.
- Neglecting to Discuss Results: Simply filling out a chart without discussing the results can make it feel like a chore. Use the charts as a starting point for discussions about progress and goals.
Where to Find Printable Blank Charts and Graphs
There are countless resources available online where you can find printable blank charts and graphs. Here are some reliable options:
- Educational Websites: Many educational sites offer free downloadable resources. Websites like Teachers Pay Teachers often have charts created by educators for use in the classroom or at home.
- Homeschooling Blogs: Check out homeschooling blogs that specialize in printable resources. They often share charts tailored to specific subjects or age groups.
- General Printable Sites: Websites like Canva or Pinterest have a plethora of customizable chart templates that you can easily download and print.
- Library Resources: Don’t overlook your local library! Many libraries provide access to educational resources that include printable charts and graphs.
Tips for Customizing Your Charts
Customizing your charts can make them even more effective in your homeschool routine. Here are some ideas:
- Color Coding: Use different colors for different subjects or categories. This visual differentiation can make it easier for your child to understand the information at a glance.
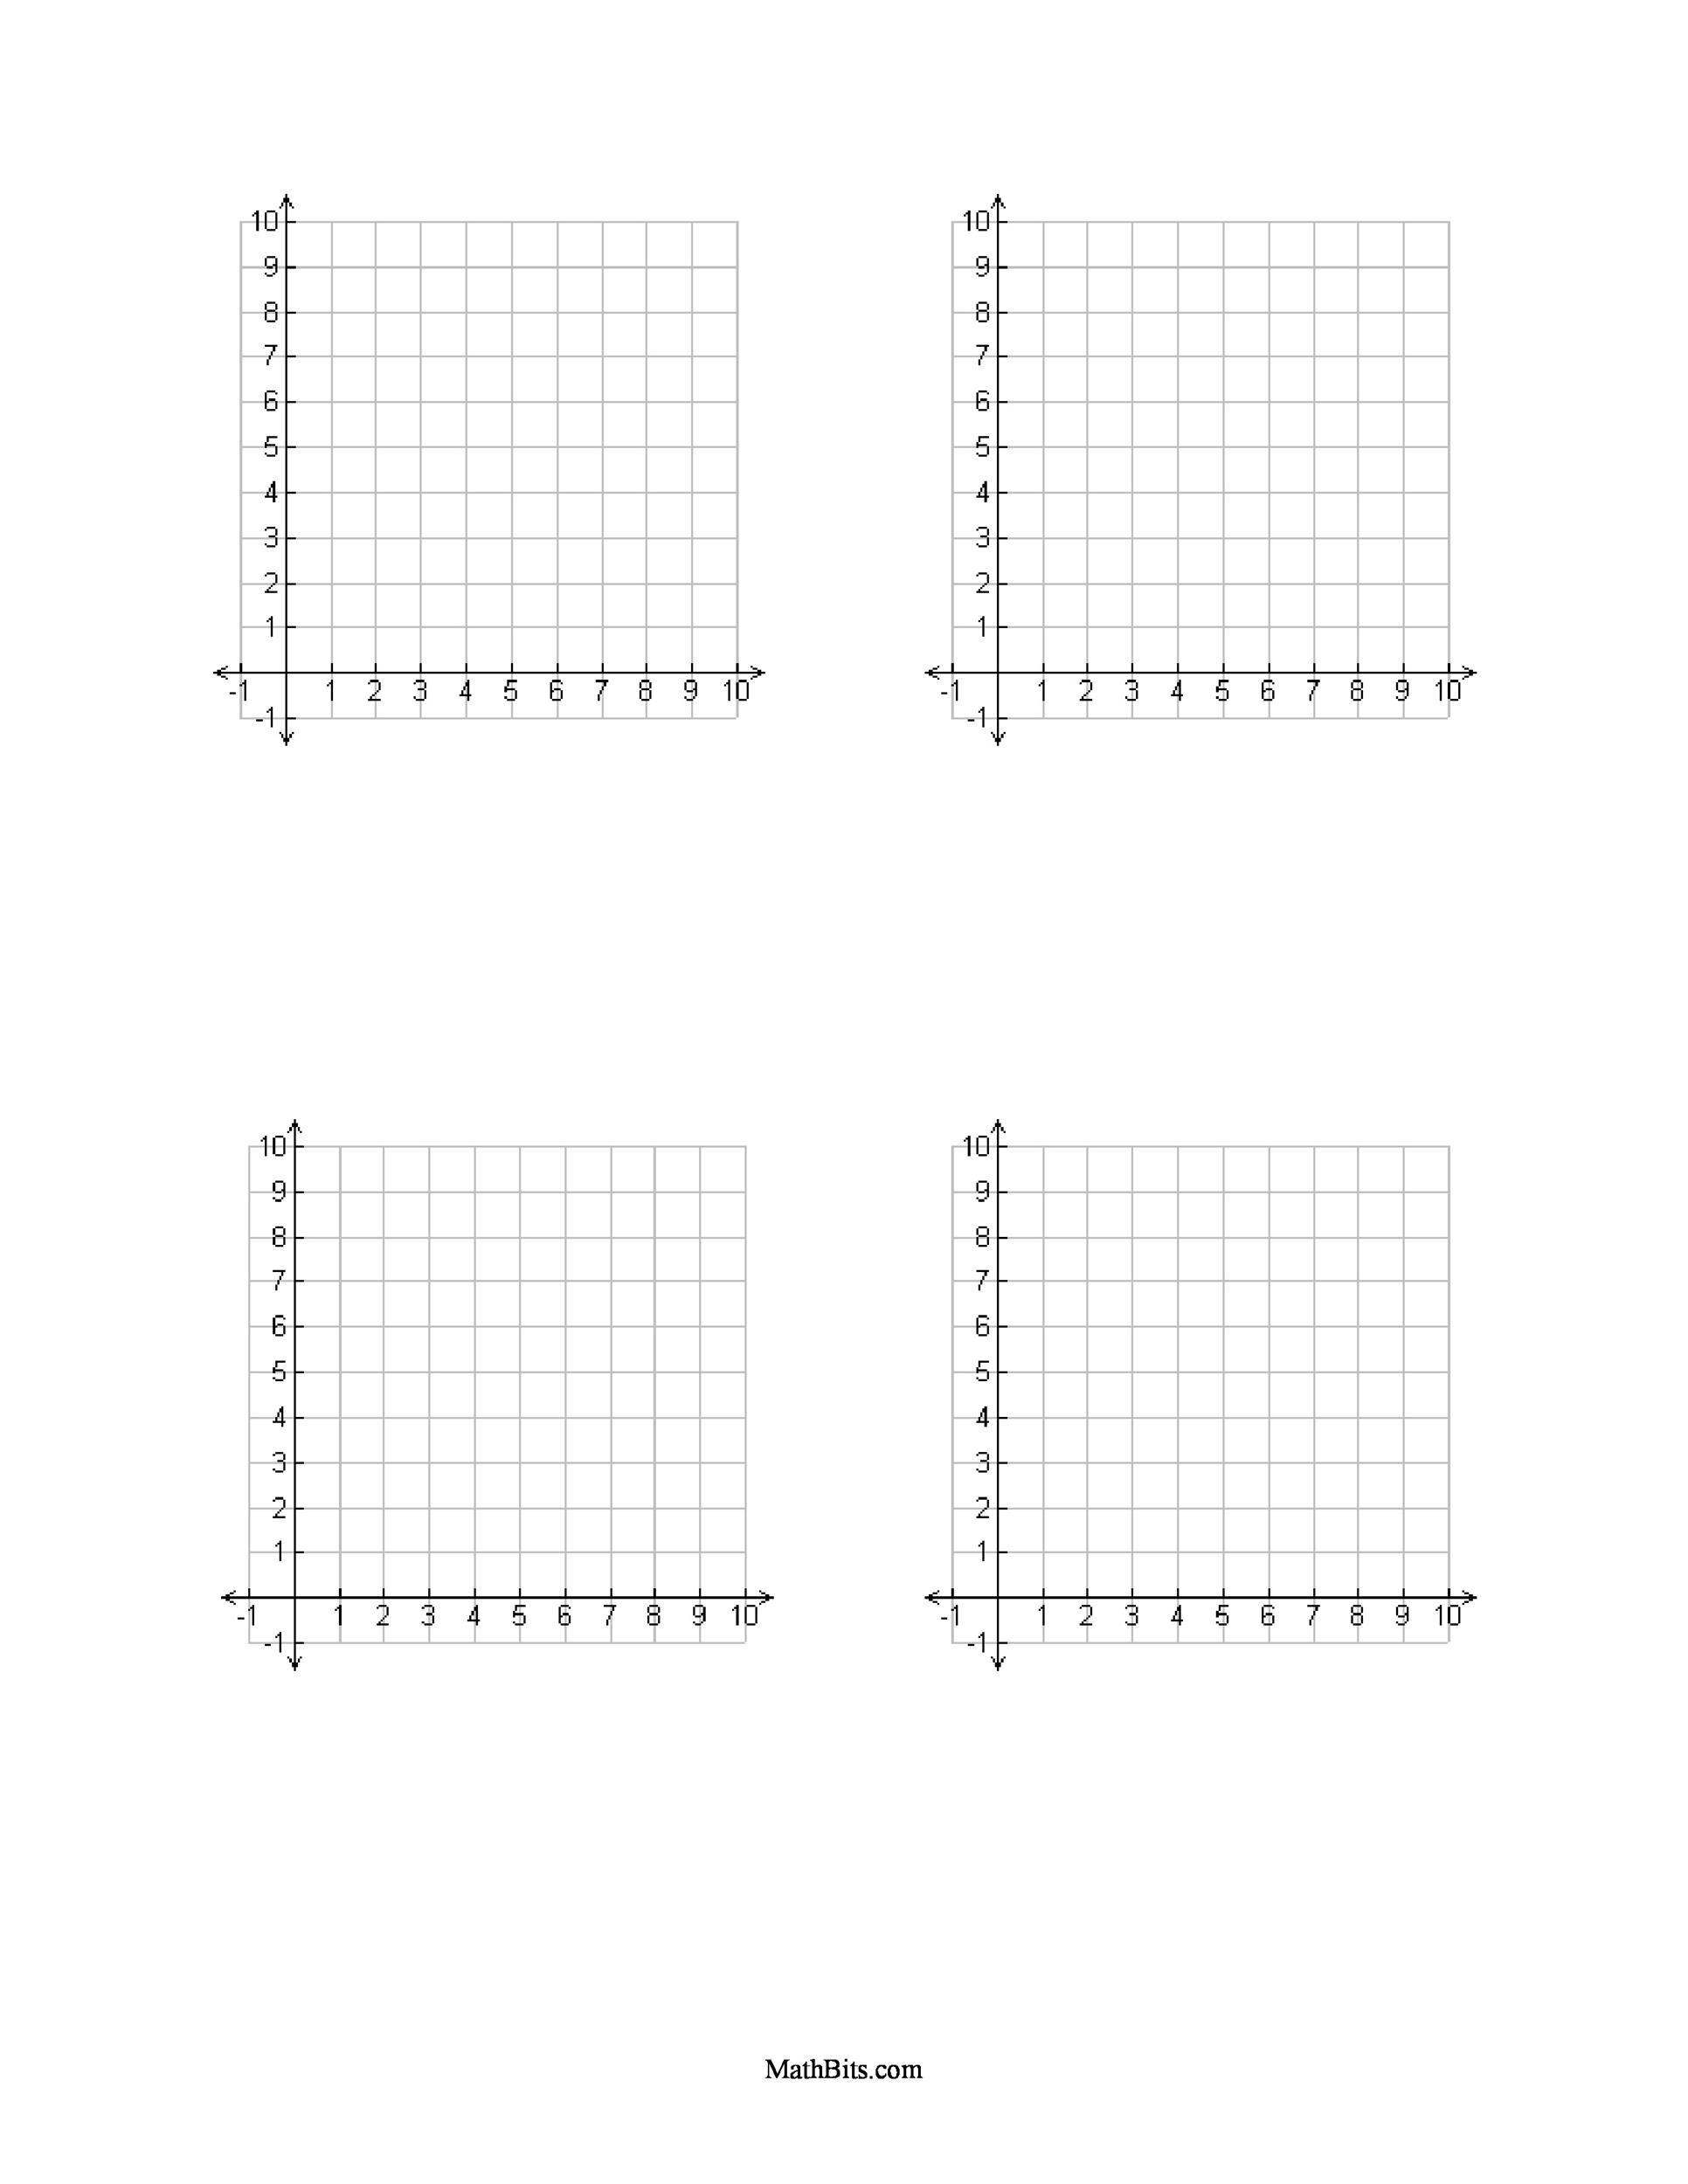
- Add Labels: Clearly label axes and categories to prevent confusion. Encourage your child to write in the labels themselves, promoting engagement.
- Include Goals: If you’re using a chart to track progress, consider including specific goals at the top. This can serve as a motivational reminder for your child.
Making the Most of Your Printable Blank Charts and Graphs
Incorporating printable blank charts and graphs into your homeschooling routine can significantly enhance your organization and tracking methods. They provide a tangible way to visualize learning progress and keep your child motivated.
For immediate action, find a chart template that suits your current homeschooling focus, print it out, and set a time to fill it in together with your child. This small step can lead to big improvements in how you both view and engage with their learning journey.